
Table of Contents
What Is Best Marketplace Value? A Practical Guide
Best marketplace value is not the lowest price but the highest outcome-per-dollar after adjusting for risk, trust, and friction. This guide introduces a practical framework to evaluate and optimize marketplace value from both buyer and seller perspectives.
Most people interpret “best marketplace value” as “cheapest option.” That shortcut causes poor buying decisions, higher refund rates, and wasted budget. Low price often hides risk, friction, and replacement cost. A better model looks at outcome reliability and total cost instead. Best marketplace value means the option that delivers the most dependable result per dollar spent, with acceptable risk and low friction.
Why It Matters?
| Insight | Why It Matters |
|---|---|
| Best marketplace value ≠ cheapest option. | Price alone doesn’t capture outcome reliability. |
| Marketplace value includes trust and risk signals. | Reduces failure and refund costs. |
| Platforms rank predicted satisfaction, not lowest price. | Algorithms measure engagement, repeat purchase, refund rate. |
| Buyers need a multi-factor evaluation checklist. | Helps avoid bad purchases. |
| Sellers can engineer value signals. | Increases conversions without price cuts. |
| Use structured scoring instead of star ratings alone. | Ratings without context are weak signals. |
What Is Best Marketplace Value?
Best marketplace value is the choice that produces the highest reliable benefit relative to total cost after adjusting for:
- Failure risk
- Seller reliability
- Return and support friction
- Compatibility and longevity
It is not automatically:
- The lowest price
- The highest rating
- The most reviewed product
- The biggest brand
Professional procurement teams use similar logic under “best value sourcing” and “total cost of ownership (TCO)” — concepts widely referenced by Gartner and McKinsey procurement frameworks. Clear marketplace decisions are operational, not theoretical.
The 5 Components That Create Marketplace Value
1. Price Efficiency vs Raw Price
Raw price is what you pay upfront. Price efficiency is what you pay per successful outcome.
Include in your real price:
-
Delivery and fees
-
Required accessories
-
Setup time
-
Replacement likelihood
-
Downtime costs
Example Scenario
| Option | Upfront Price | Expected Lifespan | Replacement Over 2 Years | Total Cost | Value Score |
|---|---|---|---|---|---|
| A | $20 | 3 months | 8 | $160 | Low |
| B | $32 | 24 months | 1 | $32 | High |
Insight: A cheaper product can cost much more over time due to failure.
2. Outcome Predictability
Predictable outcomes increase value because they reduce post-purchase regret.
Look for:
-
Specific usage reviews
-
Consistent performance comments
-
Clear but honest specs
-
Comparisons vs alternatives
Sources like Consumer Reports and Which? provide outcome-focused evaluations because predictability matters more than marketing claims.
3. Trust and Risk Signals
Trust reduces perceived risk. Reduced risk increases value.
Strong signals include:
-
Clear return windows
-
Visible warranty terms
-
Verified purchase reviews
-
Realistic rating distribution
Weak signals include:
-
Perfect 5-star profiles without detail
-
Defensive seller responses
4. Friction and Experience Cost
The Friction is a hidden tax on value.
Friction sources:
-
Confusing descriptions
-
Missing specs
-
Slow shipping
-
Complex onboarding
-
Hard returns
UX research firms like Nielsen Norman Group show that every extra step in a process reduces conversion and satisfaction.
5. Ecosystem and Longevity Fit
Value rises when a purchase fits your broader system.
Examples:
-
Software with integrations
-
Tools using standard formats
-
Devices with available spare parts
-
Services with upgrade paths
Professionals weight this heavily; beginners often overlook ecosystem fit, leading to lock-in and replacement costs.
How Marketplaces Estimate Value Internally
Marketplaces try to predict buyer satisfaction and trust — not just clicks.
Platform Signals
| Signal | What It Suggests |
|---|---|
| Conversion rate | Product desirability |
| Refund rate | Failure or mismatch risk |
| Complaint ratio | Trust and quality issues |
| Delivery success | Fulfillment reliability |
| Repeat purchases | Long-term satisfaction |
Platforms optimize for long-term trust, not lowest price.
Marketplace Value Visualization
Buyer vs Platform Value Signals
| Evaluation Lens | Platform Focus | Buyer Visible |
|---|---|---|
| Satisfaction | Refund/return data | Star rating |
| Reliability | Delivery adherence | Shipping estimate |
| Trust | Dispute ratio | Review text |
| Clarity | Conversion behavior | Listing clarity |
| Long-Term Fit | Repeat purchase | Ecosystem compatibility |
Value Scoring Framework
| Factor | Definition | How to Check | Score (1–5) |
|---|---|---|---|
| Price Efficiency | Total cost vs lifespan | Include fees & accessories | |
| Outcome Predictability | Likelihood of working as promised | Review consistency | |
| Seller Reliability | Likelihood of on-time, accurate fulfillment | Seller history | |
| Return/Warranty Terms | Ease and strength of protections | Policies listed | |
| Friction | Buying and using difficulty | Navigation, refunds | |
| Ecosystem Fit | Compatibility/upgrade paths | Specs & integrations |
Visual Data
Value Component Weights (Illustrative)
Refund Rate vs Conversion
| Refund Rate (%) | Conversion Rate (%) |
| 2% | 12.0% |
| 5% | 10.0% |
| 8% | 7.5% |
| 12% | 4.5% |
| 16% | 2.5% |
| 20% | 1.2% |
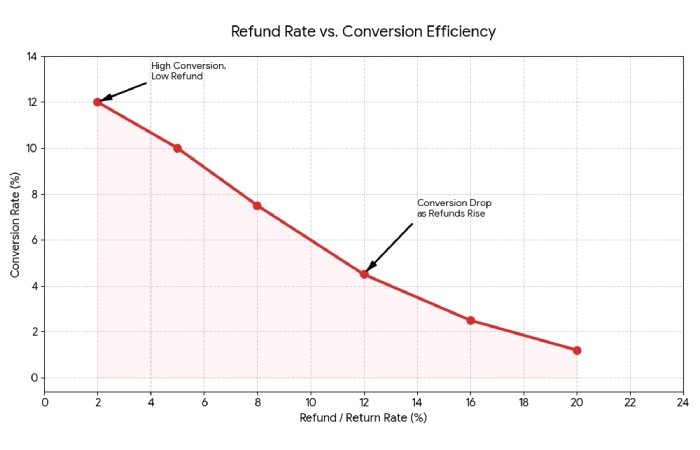
Maintaining a low refund rate is essential for maximizing conversion efficiency. A rise in returns often indicates underlying issues with product-market fit, quality control, or customer expectations, which ultimately erodes the trust required for high conversion levels. Sources like Forrester Research have documented similar patterns in marketplace behavior studies.
A Practical Buyer Checklist to Score Marketplace Value
The 6-Factor Scoring Model. Score each from 1 (weak) to 5 (strong):
-
Total cost clarity — Are all fees visible?
-
Outcome predictability — Do reviews converge on a consistent experience?
-
Seller reliability — Does the seller have a history of on-time delivery?
-
Return/warranty strength — Are protections clear and easy?
-
Friction level — Is the buying/using process smooth?
-
Compatibility/fit — Does it work with your environment?
Example Table: Option A vs Option B
| Factor | Option A | Option B |
|---|---|---|
| Total Cost Clarity | 3 | 4 |
| Outcome Predictability | 2 | 4 |
| Seller Reliability | 3 | 5 |
| Return/Warranty | 2 | 5 |
| Friction | 4 | 3 |
| Ecosystem Fit | 2 | 4 |
| Total Score | 16 | 25 |
Result: Option B has higher value even if Option A is cheaper.
Red Flags That Destroy Marketplace Value
| Red Flag | Why It Hurts Value |
|---|---|
| Repeated identical complaints | Indicates systematic failure |
| Missing technical details | Raises uncertainty |
| Policy vagueness | Increases risk |
| Variable shipping reports | Reduces reliability |
| Seller hostility | Lower trust |
Always read negative reviews first to detect patterns.
How Sellers Increase Marketplace Value
Value Engineering vs Discounting
Discounting raises clicks. Value engineering raises conversions and reduces refunds.
Better levers than price cuts:
-
Clear specifications
-
Honest limitations
-
Comparison charts
-
Setup guides
-
Transparent policies
High-Impact Seller Levers
| Seller Action | Buyer Benefit | Value Effect |
|---|---|---|
| Rewrite descriptions for clarity | Reduces uncertainty | High |
| Add compatibility tables | Reduces risk | High |
| Show delivery certainty | Increases trust | Medium |
| Simplify return steps | Lowers friction | High |
| Respond constructively | Signals credibility | High |
Scenario:
Listing Before: Feature-only bullet points.
Listing After: Feature + use case + limits + setup time.
Impact: Higher perceived value without changing price.
Marketplace Value by Buyer Scenario
| Buyer Type | Primary Value Driver | Secondary Consideration |
|---|---|---|
| Urgent shopper | Fast delivery | Price |
| Budget buyer | Total cost | Warranty |
| Professional user | Reliability | Ecosystem fit |
| Explorer | Features | Longevity |
There is no universal best value — only context-fit value.
Common Myths About Marketplace Value
| Myth | Reality |
|---|---|
| Cheapest always wins | Often fails due to high replacement cost |
| Highest rating wins | Ratings lack context without content |
| Popular equals best | Popularity can be marketing-driven |
| Brand equals value | Only if outcomes justify price |
Quick Value Decision Table
| Factor | Why It Matters | How to Check | Red Flags |
|---|---|---|---|
| Total cost | True spend | Fees & add-ons | Hidden charges |
| Outcome | Reliability | Reviews + specs | Vague praise |
| Trust | Reduces risk | Seller history | Policy gaps |
| Friction | Time cost | Returns, checkout | Complexity |
| Fit | Longevity | Compatibility | Lock-in |
Geo & Regulatory Nuance
Return and warranty protections vary by region.
Stronger consumer laws (e.g., EU consumer rights directives) generally reduce buyer risk, increasing effective marketplace value even when upfront prices are higher.
Always check marketplace and regional policy terms for protections.
Conclusion
Best marketplace value is the most dependable outcome per dollar after adjusting for risk and friction. Buyers should score value across multiple signals, and sellers should design clarity and trust — not just discounts. Outcome-focused evaluation leads to fewer regrets and better long-term results.