
Wholesale is not just bulk selling—it is a planned system that transmits business risk, margin, and pricing power across the supply chain. Consider its economics; it’s key to buying or selling profitably.
Most people think wholesale means “buying in bulk at a discount.” That is theoretically correct—but incomplete.
Wholesale is a business-to-business (B2B) model in which goods are traded in huge quantities at low per-unit pricing, allowing the buyer to resell them for a profit. The gap between cost and resale price determines profit and risk for producers, wholesalers, and retailers.
Table of Contents
What Is Wholesale?
Wholesale is the sale of items in large quantities to businesses at a lower per-unit price than retail, allowing them to resell the products for a profit. The wholesale exists to service merchants, resellers, distributors, and even institutional buyers, not end users. McKinsey research shows that digitized wholesale operations can reduce lead times and inventory carrying costs significantly.
Wholesale vs Retail
| Factor | Wholesale | Retail |
| Buyer | Business | Consumer |
| Order Size | Bulk | Single/small |
| Price Per Unit | Lower | Higher |
| Marketing Spend | Low | High |
| Gross Margin % | Lower | Higher |
| Payment Terms | Net 30 / 60 common | Immediate |
| Risk Type | Inventory holding | Demand fluctuation |
| Customer Volume | Fewer, larger buyers | Many small buyers |
| Sales Cycle | Longer | Faster |
| Profit Model | Volume | Markup |
Wholesale makes money from volume efficiency.
Retail makes money from pricing leverage and brand positioning.
Wholesale Products – By Category & Typical MOQ
| Category | Typical MOQ | Typical Wholesale Margin | Notes |
| Apparel | 100–500 units | 20–40% | Trend-sensitive |
| Electronics | 50–200 units | 5–15% | Thin margins |
| Beauty | 200–1,000 units | 25–50% | Strong branding |
| Food & Grocery | Volume-based | 10–25% | Expiry risk |
| Home Decor | 100–300 units | 20–35% | Seasonal cycles |
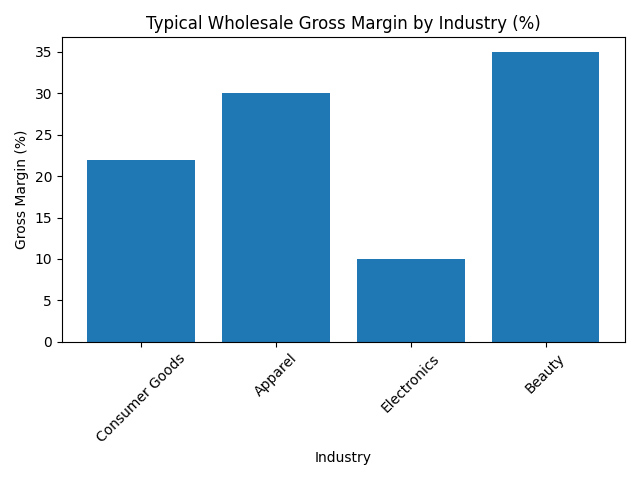
Margins depend on turnover speed and demand predictability. The profitability of wholesale varies significantly across industries. The chart below highlights average gross margins in major wholesale sectors.
Wholesale Market Structure Supply Chain View
Wholesale sits between production and retail.
| Stage | Role | Main Cost | Main Risk | Margin Focus |
| Manufacturer | Produces goods | Production | Capacity | Stable contracts |
| Wholesaler | Buys bulk & resells | Inventory | Overstock | Turnover speed |
| Retailer | Sells to consumer | Marketing | Demand shifts | High Markup |
Wholesale markets exist globally and often cluster geographically.
Major Wholesale Markets by Country
| Country | Key Wholesale Markets | Focus Products |
| USA | New York Garment District | Apparel |
| USA | Los Angeles Fashion District | Fashion & accessories |
| UK | Birmingham Wholesale Markets | Food & produce |
| India | Chandni Chowk | Textiles, general goods |
| India | Crawford Market | Food & groceries |
| China | Yiwu International Trade Market | Global mixed goods |
| UAE | Dubai Wholesale City | Electronics, consumer goods |
Physical wholesale markets continue to dominate in Asia and the Middle East, while the US and UK rely more on hybrid and digital systems.
Wholesale Pricing Structure
| Component | Example Cost (USD) |
| Manufacturing | 8 USD |
| Shipping & Duties | 2 USD |
| Packaging | 1 USD |
| Landed Cost | 11 USD |
| Wholesaler Margin (25%) | 2.75 USD |
| Wholesale Price | 13.75 USD |
| Retail Markup (100%) | 13.75 USD |
| Final Retail Price | 27.50 USD |
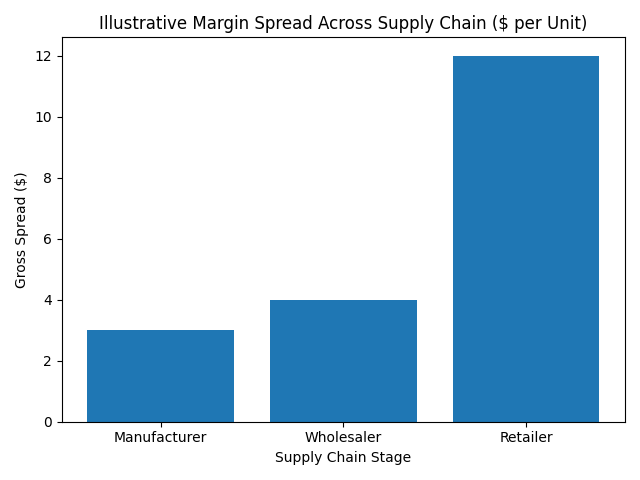
Wholesale pricing must leave sufficient scope for retailer margin. The following visual illustrates how profit margins typically expand from manufacturer to retailer.
Wholesale Pricing by Country
| Country | Wholesale Margin | Payment Terms | Tax Consideration |
| USA | 15–30% | Net 30 common | Sales tax exemption with a resale certificate |
| UK | 15–35% | 30 days invoice | VAT applied |
| India | 10–25% | Negotiable | GST structure |
| China | 5–20% | Often upfront | Export VAT rules |
| UAE | 15–30% | Flexible | Low corporate tax |
Regulatory structures impact pricing structure.
Wholesalers Online – Digital B2B Platforms
Online wholesale platforms have transformed sourcing.
| Platform | Type | Best For | Country Base | Pricing Model |
| Alibaba | Global B2B | Importing from Asia | China | MOQ-based |
| Faire | Curated B2B | Retail boutiques | USA | Commission model |
| Tundra | Commission-free | Small retailers | USA | Direct supplier pricing |
| IndiaMART | B2B directory | Domestic sourcing | India | Supplier negotiated |
| DHgate | Small MOQs | Online sellers | China | Tier pricing |
Online wholesalers reduce sourcing barriers—but pricing correction still applies.
Specialists in Wholesale & Supply Chain Strategy
| Specialist | Expertise | Known For |
| Martin Christopher | Supply chain strategy | Logistics research |
| Philip Kotler | Distribution channels | Marketing frameworks |
| Peter Drucker | Business systems | Distribution efficiency |
| National Retail Federation | Retail & wholesale trends | Industry benchmarks |
| International Chamber of Commerce | Trade terms | Incoterms standards |
Their research emphasizes turnover, logistics efficiency, and margin control.
Reviews of Online Wholesale Platforms
| Platform | Strength | Weakness | Best For |
| Alibaba | Massive supplier base | Quality variability | Importers |
| Faire | Retail-friendly terms | Limited global sourcing | Boutique stores |
| Tundra | No commission | Smaller selection | US retailers |
| IndiaMART | Local sourcing power | Negotiation required | Indian businesses |
| DHgate | Small MOQs | Product inconsistency | Small online sellers |
Online reviews commonly highlight:
- Shipping delays in cross-border trade
- MOQ rigidity
- Quality variance between suppliers
Due diligence is essential.
Inventory Strategy in Wholesale
| Strategy Component | What It Means | Why It Matters in Wholesale | Tools / Systems Used | Ideal Target Range | Risk If Ignored |
|---|---|---|---|---|---|
| Demand Forecasting | Predicting product demand using past sales data | Prevents overstocking & stockouts | ERP systems, POS analytics | Forecast accuracy 80–95% | Dead stock or lost bulk orders |
| Economic Order Quantity (EOQ) | Optimal reorder quantity formula | Balances holding & ordering cost | Inventory software | Varies by SKU | Excess storage cost |
| Safety Stock | Buffer inventory kept for uncertainty | Protects against supplier delays | Automated stock alerts | 5–15% extra buffer | Missed client contracts |
| Inventory Turnover Ratio | Times inventory is sold annually | Measures capital efficiency | Accounting dashboards | 4–8x per year (wholesale avg) | Cash flow blockage |
| ABC Analysis | Categorizing products by value & importance | Focuses capital on high-value SKUs | Warehouse software | A = 20% items, 80% revenue | Misallocated capital |
| Just-in-Time (JIT) | Ordering goods close to sale time | Reduces holding cost | Supplier integration tools | Used in fast-moving goods | Supply disruption risk |
| Warehouse Optimization | Efficient storage layout | Faster bulk dispatch | WMS systems | <48 hr dispatch time | Shipping delays |
| Drop Shipping | Supplier ships directly to retailer | Reduces warehouse cost | E-commerce platforms | Margin dependent | Lower control on delivery |
| Bulk Discount Strategy | Buying high volume for price advantage | Improves margin spread | Supplier contracts | 5–20% cost reduction | Overstocking risk |
| Inventory Aging Analysis | Tracking slow-moving stock | Prevents obsolete inventory | ERP reports | Review monthly | Dead inventory losses |
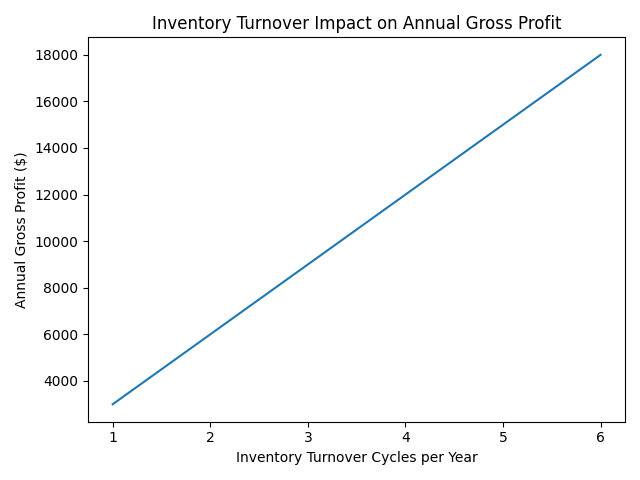
Inventory turnover directly influences wholesale profitability. The faster inventory cycles, the more revenue can be generated annually without increasing fixed costs.
Wholesale and Retail: Margin Transfer Model
Wholesale and retail are interconnected.
| Question | Wholesale | Retail |
| Who holds inventory longer? | Wholesaler | Sometimes retailer |
| Who spends more on marketing? | Retailer | Retailer |
| Who earns a higher margin %? | Retailer | Retailer |
| Who handles bulk logistics? | Wholesaler | No |
Retail often doubles wholesale pricing (keystone pricing model).
Cash Flow & Payment Terms
| Term | Meaning | Risk Level |
| Net 30 | Pay in 30 days | Moderate |
| Net 60 | Pay in 60 days | Lower pressure |
| 50% Deposit | Half upfront | Higher buyer risk |
| COD | Pay at delivery | Balanced |
Payment timing often matters more than price.
Starting a Wholesale Business – Cost Structure Example
| Cost Area | Estimated Range |
| Initial Inventory | $5,000–$50,000 |
| Warehouse Space | $500–$3,000/month |
| Staff | Variable |
| Logistics | 5–15% revenue |
| Technology | $50–$500/month |
Capital planning determines survival.
Risks in Wholesale
| Risk | Why It Happens | Prevention |
| Overstock | Poor forecasting | Smaller test orders |
| Dead Stock | Trend shift | Diversified SKUs |
| Supplier Lock-in | Single source | Multi-vendor strategy |
| Margin Compression | Competition | Differentiation |
Wholesale magnifies forecasting mistakes.
Global Wholesale Evolution
Wholesale markets are shifting:
- Traditional physical markets remain dominant in India and China.
- Hybrid digital models dominate the US and UK.
- Cross-border trade relies on standardized trade rules defined by the International Chamber of Commerce.
- Logistics technology improves visibility.
Wholesale is becoming more data-driven and tech-enabled.
Final Insight
Wholesale is not simply about getting products cheaper. It is about understanding cost layers, managing risk allocation, negotiating payment timing, scaling through volume discipline, and operating inside global trade structures.
If you treat wholesale as a shortcut to cheap goods, you will struggle. If you treat wholesale as a structured economic system—where margin, risk, and turnover interact—you gain leverage. And in wholesale, leverage is the real profit driver.